Read the forecast behind the picture
By Spinnybarr, developer of Wynspira · Updated October 11, 2026
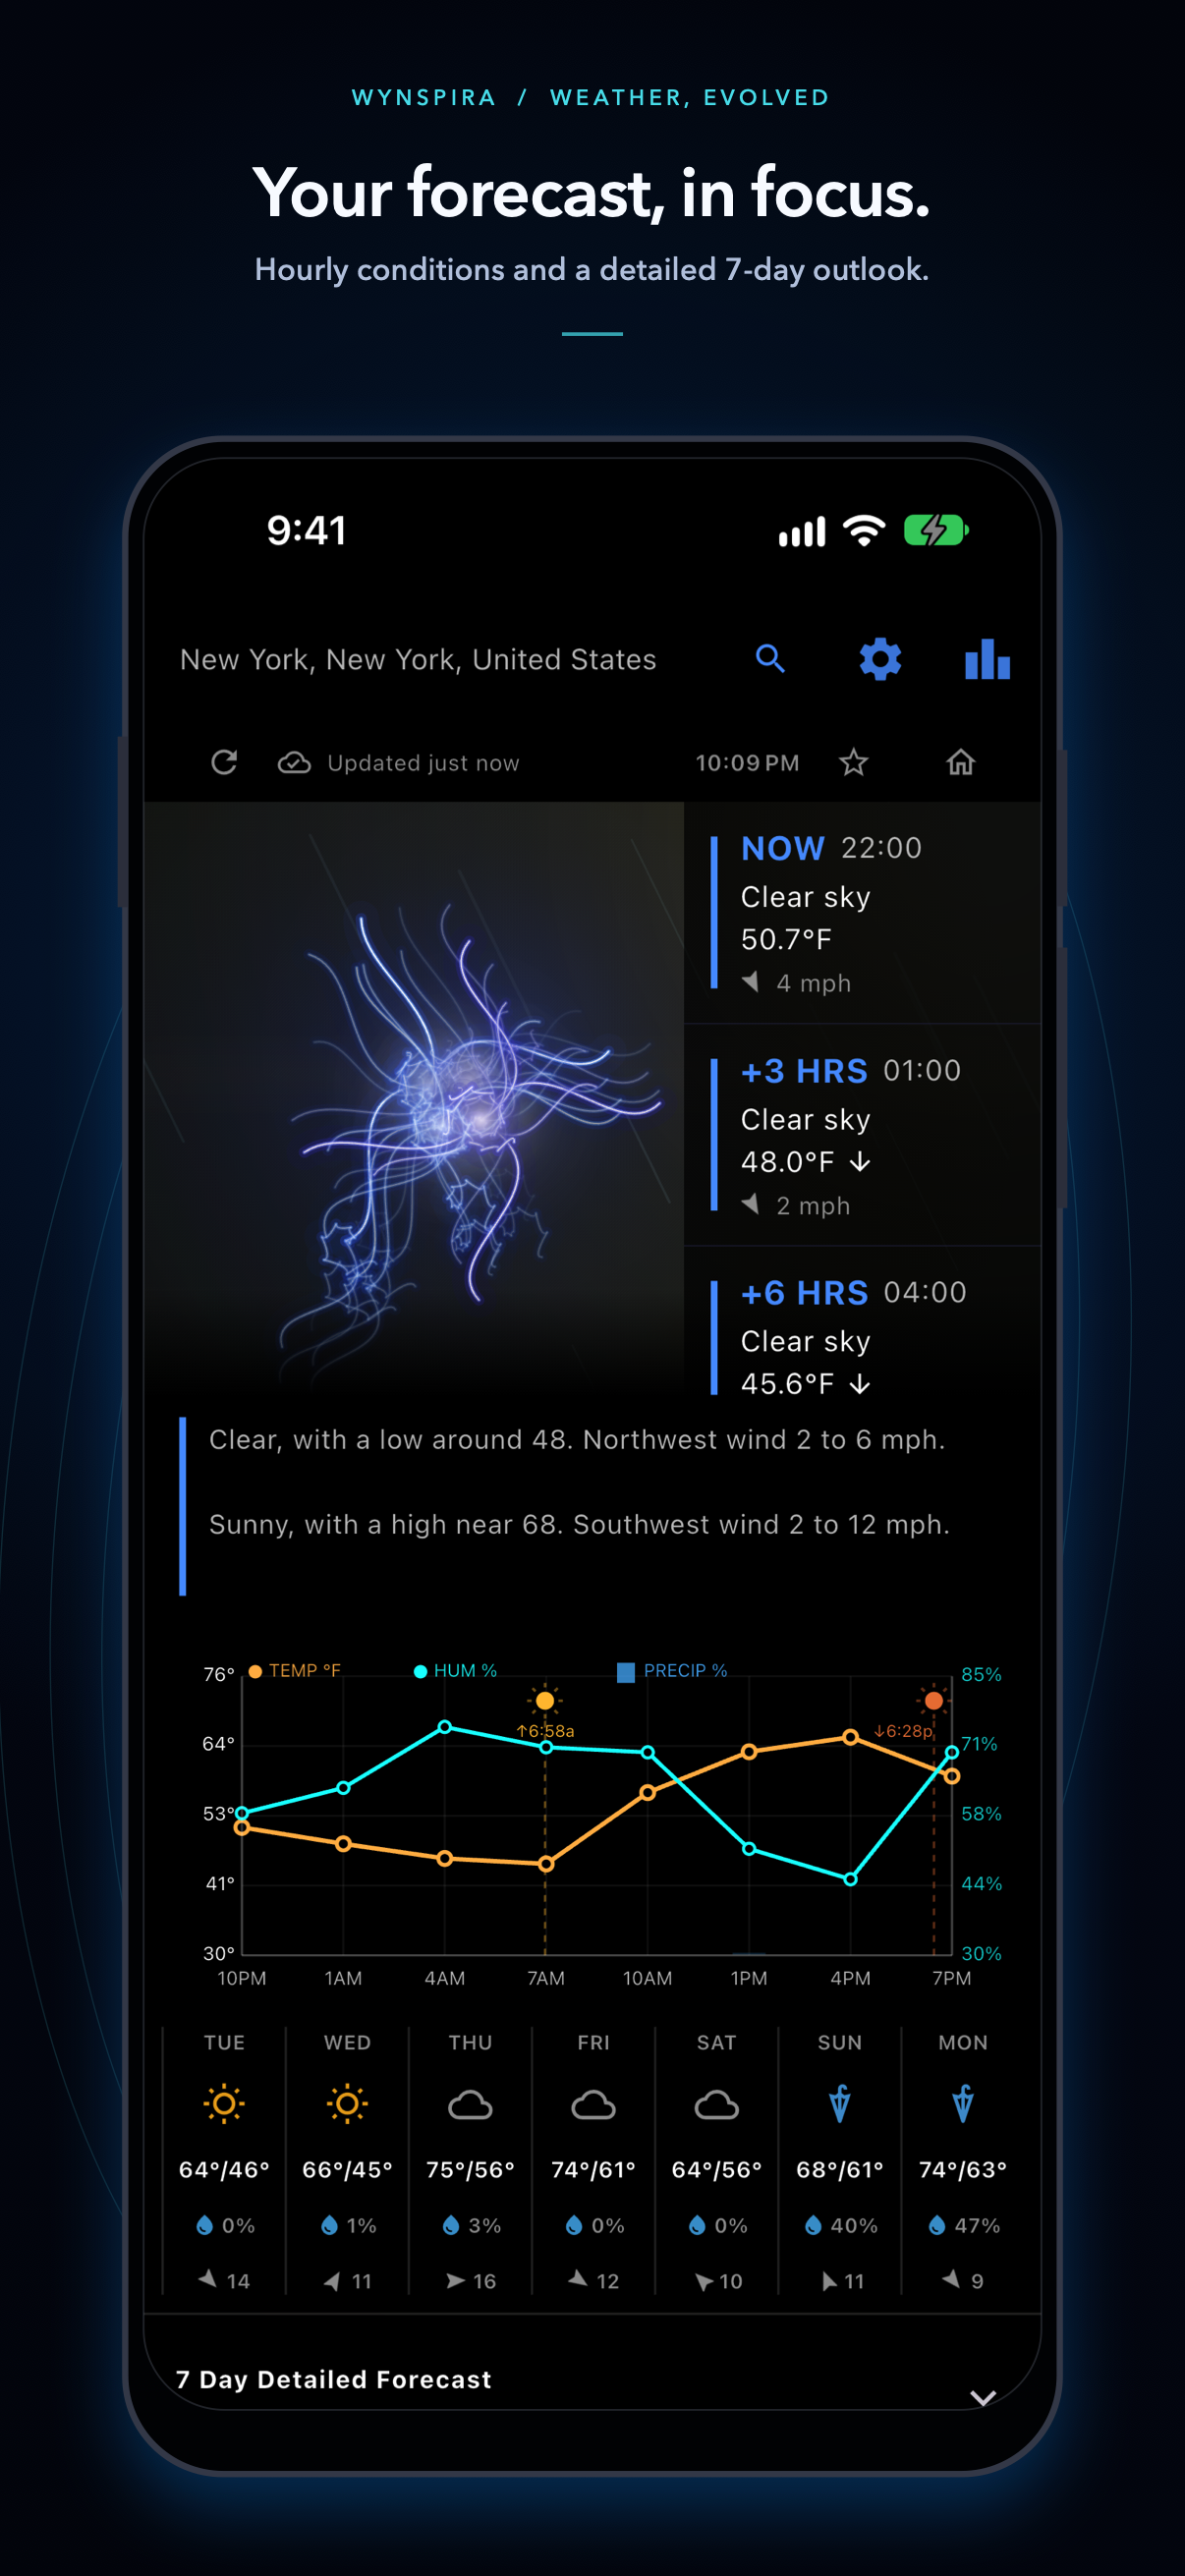
A weather icon is a useful summary, but it cannot answer every planning question. Wynspira's current readings, hourly chart and seven-day outlook cover different time windows. Start with the place, the time and the units, then use the view that matches what you want to do.
Choose the right place and time window
- Open Wynspira and use Search to choose a location, or choose GPS if you want to share your device location. Check the selected place rather than assuming it is where you are now.
- Use current conditions for the modeled weather around now. Use the hourly chart for when conditions may change over the day.
- Use the seven-day outlook to compare days, then open the detailed forecast view for the period you care about. A daily summary can hide a wet morning followed by a dry afternoon.
- Set Celsius or Fahrenheit in Settings. Check the units shown beside wind and rainfall too, especially when comparing with another forecast service.
When viewing a distant location, interpret its forecast in that location's time zone. A period labeled evening in another city may occur during your morning. Comparing timestamps from different places without their time zones can make two readings look simultaneous when they are not.
What the main readings mean
Temperature, apparent temperature and daily range
Air temperature is the modeled temperature, not the daily maximum. Apparent or feels-like temperature accounts for additional conditions that affect perceived warmth or cold. A day's high and low describe the range across that day; neither should be treated as the temperature at the hour of your trip.
Rain probability versus rainfall amount
A precipitation probability is a likelihood for a specified forecast period and location. It is not a promise that rain will last for that percentage of the day, and it is not a measure of how much rain will fall. An amount in millimeters or inches measures accumulation over its stated interval. Always compare the time windows as well as the values.
Wind speed versus gusts
Sustained wind and short-lived gusts are different measurements. A modest sustained wind value does not rule out stronger gusts. Local exposure also matters: an open coast or ridge may feel different from a sheltered street represented by the same forecast area.
Humidity and cloud cover
High relative humidity means the air is closer to saturation at its temperature; it is not the same as high rain probability. Cloud cover describes sky coverage, not how much precipitation reaches the ground. These readings help explain the scene but are not substitutes for the precipitation forecast.
Example: planning a late-afternoon walk
Illustrative readings, not a live forecast
Suppose the daily high is 20°C, but the hourly temperature at 17:00 is 14°C. The rain probability for that hour is 60%. The daily icon alone cannot tell you that the afternoon will be cooler than the high.
Read the surrounding hours to see the trend, compare feels-like temperature where available, and check wind and the weather description. A 60% rain probability does not mean it will rain for 36 minutes, nor does it specify rainfall amount. Rain cover may be sensible, but revisit the forecast closer to departure rather than treating the example numbers as certainty.
What does global extremes actually compare?
The panel is a way to explore contrasts around the world. It ranks a fixed sample of 264 locations: national capitals, Canadian provincial and territorial capitals, U.S. state capitals, and five Antarctic stations. It selects one winner per region for hottest, coldest, windiest and wettest, then sorts those regional winners.
It is not a world-record table or an exhaustive search of Earth. A desert, mountain or smaller town outside the sample can be more extreme than the displayed location. Hottest and coldest use modeled current air temperature, not all-time records; windiest uses the sampled wind-speed reading, not necessarily the strongest gust anywhere.
Wettest compares the provider's current precipitation accumulation. Open-Meteo reports a current interval, commonly 900 seconds, so this can represent the preceding 15 minutes rather than a whole day. A wettest value should not be compared directly with a daily rainfall total. Rankings omit missing readings for the affected metric in the current API.
Why repeated visits can show the same winners
The backend shares one snapshot across users. It is considered fresh for 30 minutes; after that, the next request initiates a refresh. There is no automatic refresh every 30 minutes when nobody opens the panel. Switching between metric tabs reuses the data already loaded in the panel.
During refresh or a provider failure, the service may return the last successful snapshot while it is under two hours old. The API marks this in freshness headers, although installed app versions may not display that metadata. Treat the panel as an informational comparison, not a real-time hazard feed. If the last-good snapshot is two hours old or older and cannot be replaced, the service reports that data is unavailable.
Use forecasts as guidance, not guarantees
Global forecasts are supplied through Open-Meteo weather models. Supported U.S. locations also have National Weather Service forecasts and alerts. Different models, update times and terrain representation can explain disagreements between services. Longer-range forecasts are especially useful for trends rather than exact hour-by-hour promises.
If a reading is missing, do not infer calm wind, zero rain or safe conditions. Check official local warnings for hazards and follow emergency guidance. Wynspira's fractal animation is artistic and is not an observation of lightning or a warning signal.
For help interpreting an app display or to report an issue, contact Spinnybarr. Include the selected location, units and forecast time, but do not send private credentials or exact personal location details you do not want to share.